Table of Contents
- From Raw Spectra to Protein ID: A Practical Framework
- The Peptide-Spectrum Matching (PSM) Workflow Explained
- Interpreting MS/MS Fragmentation Patterns: b-Ions and y-Ions
- Mass Spectrometry Data Analysis Software Tools: Open-Source vs. Commercial
- LC-MS/MS Data Validation: FDR, Mass Accuracy, and Spectral Artifacts
- Integrating Machine Learning into Your Bioinformatics Pipeline
- Conclusion: Building Repeatable Confidence in Every Dataset
- Frequently Asked Questions
Last Updated: September 12, 2026
From Raw Spectra to Protein ID: A Practical Framework
Interpreting mass spectrometry data for peptides means converting raw spectra into confident protein identifications by matching experimental fragmentation patterns against theoretical sequences. At Minuteman Peptides, our certificates of analysis depend on accurate spectral interpretation, and we provide materials for labs needing repeatable results across batches.
Mass spectrometry measures the mass-to-charge ratio of ionized molecules to determine their structure and composition (peer-reviewed research). In proteomics, peptides fragment predictably, and the resulting pattern tells you which peptide was there.
The workflow has four stages. Each can fail silently, and an upstream failure usually surfaces as a puzzling downstream result.
| Stage | What Happens | Common Failure | Where to Look First |
|---|---|---|---|
| Sample prep and digestion | Proteins cleaved into tryptic peptides | Incomplete digestion, missed cleavages | Digest efficiency, enzyme ratio |
| Precursor selection | Peptides ionized and isolated for fragmentation | Low ionization efficiency, co-isolation | Signal intensity, isolation window |
| MS/MS fragmentation | Peptide backbone breaks into b-ions and y-ions | Poor fragmentation, noisy spectra | Collision energy settings |
| Database search and scoring | Spectra matched to theoretical spectra | Wrong database, loose thresholds | FDR, mass accuracy |
The Peptide-Spectrum Matching (PSM) Workflow Explained
Peptide-spectrum matching compares an experimental MS/MS spectrum against theoretical spectra from a protein database, producing a scored list of candidate peptide sequences ranked by how well each explains the observed fragment ions.
The workflow runs in a fixed order; skipping a step creates problems you cannot fix later:
- Convert raw files to an open format such as mzML so downstream tools can read them.
- Specify the digestion enzyme, typically trypsin, so the search engine knows where to cut.
- Set fixed modifications (carbamidomethylation on cysteine is standard) and variable modifications such as oxidation on methionine.
- Define the precursor and fragment mass tolerance windows.
- Search spectra against the target database and a decoy database.
- Filter results by score threshold and estimated false discovery rate.
From Precursor Selection to PSM Scoring
Data-dependent acquisition picks the most intense precursor ions from a survey scan and fragments them one at a time; data-independent acquisition fragments everything in defined windows. DDA gives cleaner spectra per peptide; DIA gives more consistent coverage but requires different analysis software.
Scoring functions reward spectra that explain many fragment ions with high mass accuracy. A high-scoring PSM is not automatically correct, so every serious pipeline pairs target scores with decoy-based error estimates.
A common mistake is setting the fragment mass tolerance too wide to “catch more matches.” Wider tolerance inflates scores for random matches and quietly raises your false discovery rate. Match the tolerance to your instrument’s actual resolving power.
Interpreting MS/MS Fragmentation Patterns: b-Ions and y-Ions
Fragment ions are the readable alphabet of peptide sequencing. When collision-induced dissociation breaks the peptide backbone, fragments fall into predictable series, and reading those series tells you the sequence. The practical skill is reading a real spectrum, deciding whether it is trustworthy, and knowing what to do when it is not.
The two series that matter most are b-ions, which retain the N-terminus, and y-ions, which retain the C-terminus. Adjacent ions differ by the mass of one amino acid residue, so a complete ladder lets you read the sequence from either end. In CID, y-ions dominate the high-m/z region; in HCD, b-ion intensity rises and the series are more balanced (peer-reviewed research).
What a Good Spectrum Actually Looks Like
A high-quality MS/MS spectrum for a tryptic peptide has four recognizable features:
- A near-complete y-ion ladder. For a peptide of length n, you expect y1 through y(n-1). Missing one or two internal ions is normal; missing half the ladder is not.
- A confirming b-ion series. At least a partial b-series should be present, even if intensities are low.
- Mass errors under 10 ppm on the matched fragments when the instrument is calibrated.
- A precursor mass that matches the sum of the residue masses plus water and any specified modifications.
A spectrum missing three or more of these is a candidate for rejection, not a candidate for a looser score threshold.
Reading a Raw Spectrum: A Visual Walkthrough
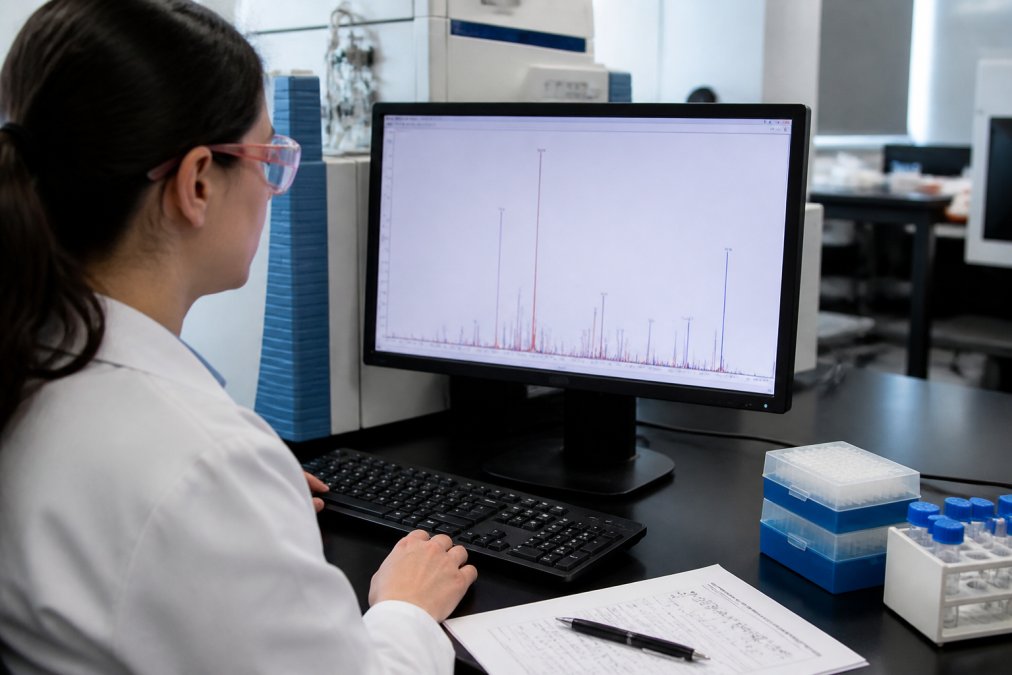
Start at the highest m/z values on the right, where the y-ion series often dominates in CID fragmentation. Work leftward, checking whether the gaps between peaks match known residue masses. The monoisotopic residue masses you will use most often are glycine at 57.02146 Da, alanine at 71.03711 Da, serine at 87.03203 Da, proline at 97.05276 Da, valine at 99.06841 Da, and leucine/isoleucine at 113.08406 Da, the last pair is isobaric, so discriminating between them requires retention time or dedicated fragmentation behavior.
Three practical checks:
- Do the gaps correspond to real amino acid masses, or to noise?
- Is there a complementary b-ion series confirming the same sequence?
- Are the most intense peaks explained by the peptide, or by a co-isolated contaminant?
High sequence coverage makes identification straightforward; low coverage means you are guessing, and the score should reflect that.
Annotated Examples: Good vs. Problematic Spectra
The fastest way to build intuition is comparing a clean spectrum against a compromised one side by side.
Clean spectrum (peptide ~1,200 Da, doubly charged, tryptic): A dense y-ion ladder from y1 to y(n-1), a partial b-series, mass errors within a few ppm, and a single dominant precursor with no co-eluting signal. Use this to calibrate your eye.
Chimeric spectrum (two co-isolated precursors): The y-ion ladder breaks in the middle, b-ions appear that cannot belong to the same sequence, and the search engine returns a mediocre top hit. The tell: no single sequence explains more than about 60 percent of the intense peaks. Fix it with a narrower isolation window or gas-phase fractionation, not a lower score threshold.
Contaminant-dominated spectrum: Peaks spaced 44.026 Da apart (polyethylene glycol) or 14.0157 Da apart (hydrocarbon series) with no recognizable b/y ladder. These come from plastics, detergents, and buffers, and no search engine will identify them correctly. Fix it upstream: change consumables, re-run blanks, and check the LC gradient for carryover.
In-source fragmentation artifact: A precursor mass offset from the expected peptide mass by a small neutral loss (water, ammonia, or a labile modification). The spectrum looks real but the precursor matches no tryptic candidate. Lower the source temperature or in-source collision energy before assuming the peptide is novel.
A common mistake is setting the fragment mass tolerance too wide to “catch more matches.” Wider tolerance inflates scores for random matches and quietly raises your false discovery rate. Match the tolerance to your instrument’s actual resolving power.
When the Spectrum Is Bad: A Triage Order
Before touching a search parameter, work through this order. It resolves most “why did this fail” cases without loosening thresholds.
- Check the precursor. Is the charge state plausible for the m/z? Is the monoisotopic peak assigned correctly, or did the software pick an isotope?
- Check the isolation window. Was the window wide enough to co-isolate a contaminant? Narrow it and re-acquire.
- Check the collision energy. Too low produces an intact precursor with few fragments; too high produces dominant immonium ions and a sparse ladder.
- Check the sample. Run a blank and a standard. If the standard also looks bad, the problem is the instrument or the method, not the sample.
- Only then consider loosening search parameters, and if you do, re-validate the FDR on the same dataset.
This triage order is the practical counterpart to the theory above, and the step most guides skip, which is why so many labs loosen thresholds to compensate for an upstream problem.
Mass Spectrometry Data Analysis Software Tools: Open-Source vs. Commercial
The software you choose shapes what questions you can ask of your data. Open-source tools offer transparency and no license cost; commercial platforms offer support, curated spectral libraries, and interfaces for teams without dedicated bioinformaticians.
| Category | Open-Source | Commercial |
|---|---|---|
| Cost | No license fee | License or subscription |
| Transparency | Source code inspectable | Closed, vendor-validated |
| Support | Community forums | Vendor support contracts |
| Best for | Custom pipelines, method development | Regulated workflows, high-throughput labs |
For a core facility running standard workflows, a commercial platform often pays for itself in reduced setup time. For a group building a custom bioinformatics pipeline, open-source tools let you tune every parameter. Many labs run both: commercial software for routine identification, open-source tools for method development and validation.
LC-MS/MS Data Validation: FDR, Mass Accuracy, and Spectral Artifacts
Validation separates confident datasets from optimistic ones. Three checks catch most problems before they reach a publication or a certificate of analysis.
False discovery rate (FDR) estimates the proportion of incorrect identifications in your result set. The standard approach searches against a decoy database and uses the decoy-to-target ratio to estimate error. A one percent FDR threshold is common, though the right cutoff depends on your downstream use (peer-reviewed research).
Mass accuracy is the difference between measured and theoretical mass, usually expressed in parts per million. Tight mass accuracy narrows the candidate list and strengthens every downstream claim.
Spectral artifacts are the signals that look like peptide fragments but are not. Common culprits include:
- Contaminant polymers from plastics and buffers
- Co-isolated precursors producing chimeric spectra
- In-source fragmentation creating false precursor masses
Chimeric spectra are the most damaging artifact in high-throughput work. Two co-isolated peptides produce a spectrum that matches neither sequence well, yet the search engine still returns a top hit. If a PSM scores poorly but confidently, suspect co-isolation before you trust the identification.
Integrating Machine Learning into Your Bioinformatics Pipeline
Machine learning has moved from research curiosity to standard practice in peptide identification. The clearest gain is rescoring: a model re-ranks the search engine’s candidate PSMs using features the original scoring function ignores, such as retention time prediction and fragment intensity patterns. But the value of a machine learning step depends almost entirely on which features you feed it, how you validate it, and whether it transfers to your instrument.
Where Machine Learning Actually Helps
The practical benefit is more identifications at the same false discovery rate: instead of loosening thresholds and accepting more false positives, rescoring separates true matches from false ones more sharply. Four integration points show up in real pipelines:
- Rescoring PSMs after the initial database search. Post-processing tools such as Percolator take the search engine’s output and re-rank candidates using learned feature weights rather than fixed ones. The features typically include the search engine score, mass error, number of matched fragments, peptide length, and charge state. The gain is usually measured in additional identifications at a fixed one percent FDR, not in a lower FDR at the same identification count.
- Predicting retention time. Models trained on indexed retention time standards can filter candidates that elute at implausible points in the gradient. This is especially useful for isobaric peptides and for modified peptides whose mass alone does not distinguish them.
- Predicting fragment intensities. A model that predicts which b-ions and y-ions should be intense lets you score a spectrum against a predicted pattern rather than a binary match list. This is the mechanism behind several modern rescoring approaches and is why fragment intensity is now a first-class feature rather than a tiebreaker.
- Detecting artifacts. Classifiers trained on known contaminant and chimeric spectra can flag suspect PSMs before they reach downstream analysis. This is the least mature of the four and the one most sensitive to training-set bias.
The Features That Matter
A rescoring model is only as good as its inputs. The features that carry the most weight are:
- Mass error on the precursor and on matched fragments, in ppm.
- Number and fraction of matched b/y ions, normalized by peptide length.
- Score from the primary search engine (for example, the cross-correlation score or the hyperscore, depending on the tool).
- Retention time deviation between observed and predicted.
- Peptide properties such as length, charge, and the presence of missed cleavages or variable modifications.
Adding features correlated with the search engine score but lacking independent information tends to overfit. Add only features the primary scoring function does not already encode.
Validation: The Step Most Pipelines Get Wrong
A rescorer trained on one instrument or sample type may not transfer cleanly to another. Three validation habits separate a working pipeline from a fragile one:
- Hold out data by instrument, not by spectrum. Random spectrum-level splits leak information and inflate apparent performance. Splitting by LC-MS run or by instrument is the honest test.
- Re-estimate FDR after rescoring. A model that improves the score distribution also changes the decoy-to-target ratio. The FDR you reported before rescoring is not the FDR you have after.
- Check performance on a different sample type. A model tuned on a cell lysate may behave differently on plasma, tissue, or a synthetic peptide standard. If you cannot test this, say so in your methods.
A Minimal, Reproducible Pipeline
For a lab adding machine learning without rebuilding its stack, a workable sequence is:
- Search spectra with a standard engine against a target-decoy database.
- Export PSMs with the features listed above into a tabular format.
- Train or apply a rescoring model using a held-out instrument or run.
- Re-filter at your target FDR using the new scores.
- Document the model version, the training data, and the FDR re-estimation in your methods section.
This is deliberately conservative: it adds identifications without changing the underlying search, keeping the pipeline auditable.
A rescorer trained on one instrument or sample type may not transfer cleanly to another. Validate on your own data before you trust it in production, and never report a post-rescoring FDR that was estimated on the pre-rescoring score distribution.
The most reliable pipelines combine algorithmic scoring with human review of borderline cases. No model replaces the judgment of someone who has looked at thousands of spectra, but a well-validated model lets that person spend their time on the spectra that actually need it.
Conclusion: Building Repeatable Confidence in Every Dataset
Every step in this framework serves one goal: results you can repeat next month and defend in review. That standard applies to the peptides going into your instrument as much as to the software analyzing the output. Impure starting material produces spectra that no amount of careful interpretation can rescue.
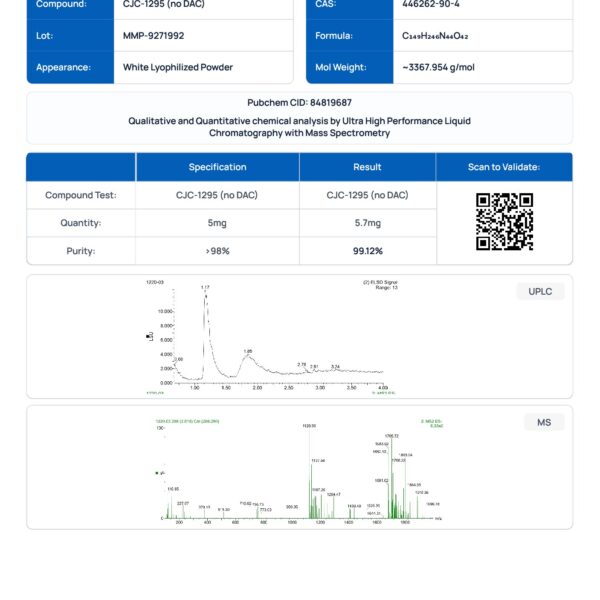
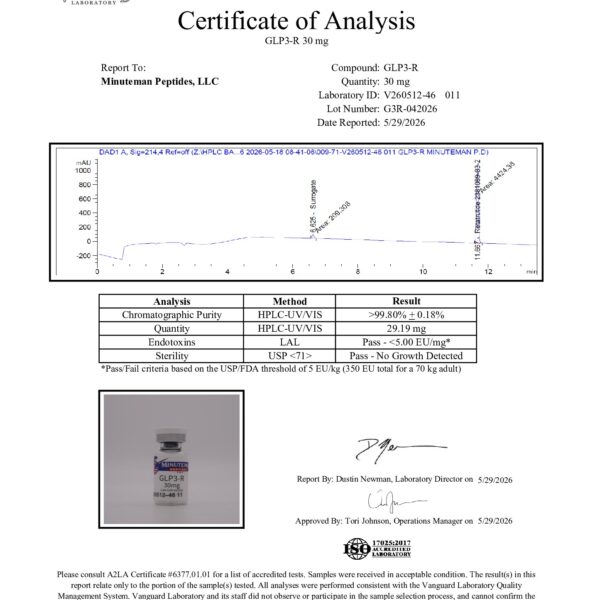
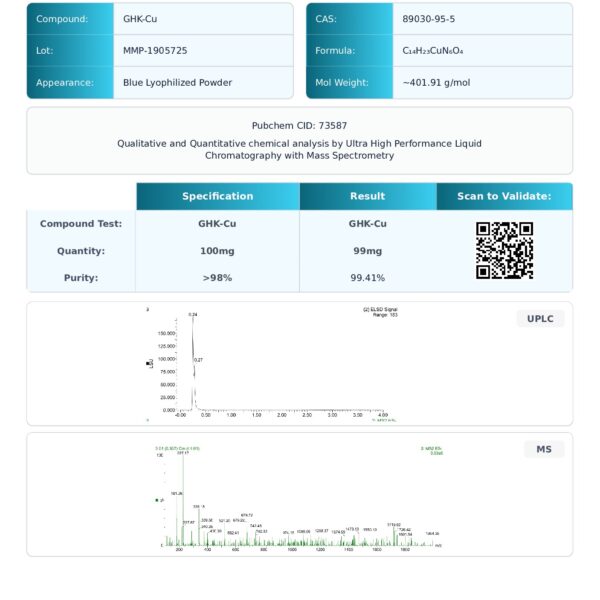
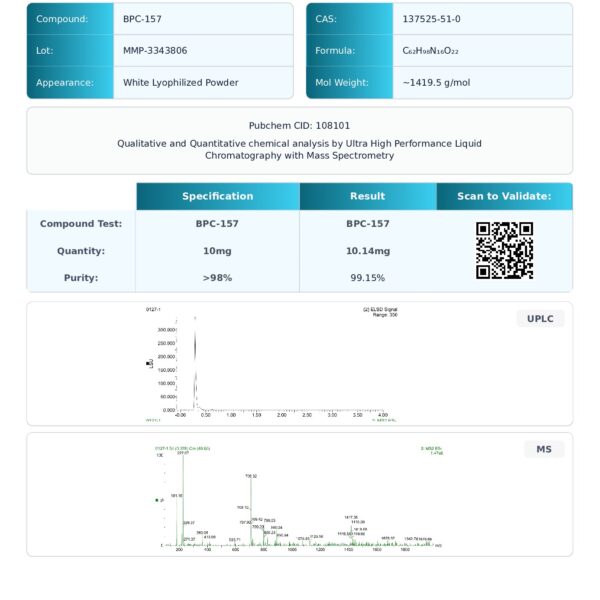
Minuteman Peptides supports that standard by sourcing from cGMP-certified, US-based manufacturing facilities and verifying every batch through independent ISO/IEC 17025 certified third-party testing, with HPLC and mass spectrometry results documented in a transparent certificate of analysis. If your research depends on repeatability across batches, start with material you do not have to second-guess.
Frequently Asked Questions
How do I interpret mass spectrometry results for peptide identification?
Start by matching the precursor ion’s mass-to-charge (m/z) ratio to candidate peptides from a database search. Then examine the MS/MS fragmentation pattern: b-ions and y-ions should form a series that covers most of the peptide backbone. Software tools score these matches using peptide-spectrum matching (PSM) algorithms. Finally, apply a false discovery rate (FDR) threshold, typically 1%, to filter confident identifications from random matches.
What is the role of Peptide-Spectrum Matching (PSM) in data analysis?
PSM is the core computational step that links an experimental MS/MS spectrum to a theoretical peptide sequence. The algorithm compares observed fragment ions against predicted b-ion and y-ion patterns generated from a protein database. Each match receives a score reflecting how well the theoretical spectra align with the real data. High-scoring PSMs become the foundation for protein identification, while low-scoring matches are discarded during FDR filtering.
How do I distinguish between noise and actual peptide signals in MS/MS data?
Real peptide signals show structured fragmentation: b-ions and y-ions appear at predictable mass intervals along the peptide backbone. Noise peaks are random and lack this sequential pattern. Check that the precursor ion’s m/z ratio is consistent with a tryptic peptide mass. Also verify that the mass accuracy falls within your instrument’s specification, typically under 5 ppm for Orbitrap data. Software tools flag low-quality spectra automatically.
What are the most common challenges in interpreting tandem mass spectrometry (MS/MS) spectra?
Co-eluting peptides create chimeric spectra where fragments from two precursors mix. Post-translational modifications shift fragment masses unpredictably. Low-abundance peptides produce weak signals that fall below detection thresholds. Ionization efficiency varies between peptides, so some sequences are underrepresented. Each challenge requires specific software settings: wider precursor isolation windows, variable modification searches, or spectral library matching to resolve ambiguous assignments.
How does ISO/IEC 17025 certification impact the reliability of mass spectrometry data?
ISO/IEC 17025 certification confirms that a testing laboratory meets international standards for competence, impartiality, and consistent operation. When a peptide supplier provides mass spectrometry data validated by an ISO/IEC 17025 certified third party, researchers can trust that the reported purity and molecular weight reflect the actual batch. This matters for experimental repeatability, especially across multiple batches over months of study.
What is the significance of HPLC and MS verification in peptide research?
HPLC separates peptide components by hydrophobicity and reveals purity as a percentage of the total peak area. Mass spectrometry confirms the molecular weight matches the expected sequence. Together, they catch synthesis errors, truncations, and impurities that purity percentage alone misses. For research requiring consistent results, always request both HPLC chromatograms and mass spectra alongside the certificate of analysis.
Confidence in spectral interpretation begins with confidence in your starting material. Minuteman Peptides provides research compounds verified by HPLC and mass spectrometry, backed by transparent certificates of analysis and independent third-party testing, so your data reflects your method rather than your supply. Get started with Minuteman Peptides and build repeatable results into every experiment.